How to Calculate LED Display Power Consumption & Resolution: A Practical Guide with a COB LED Display Case Study
Get the resolution wrong and your content stretches. Underestimate the power draw and your breaker trips on acceptance day. These two calculations gate every LED video wall project — quoting, electrical design, and site installation. This guide turns the textbook formulas into copy-paste-ready steps, then runs them through a complete 11.52 m² P1.25 COB LED display.
1. A Field Failure Story: The Breaker That Tripped on Acceptance Day
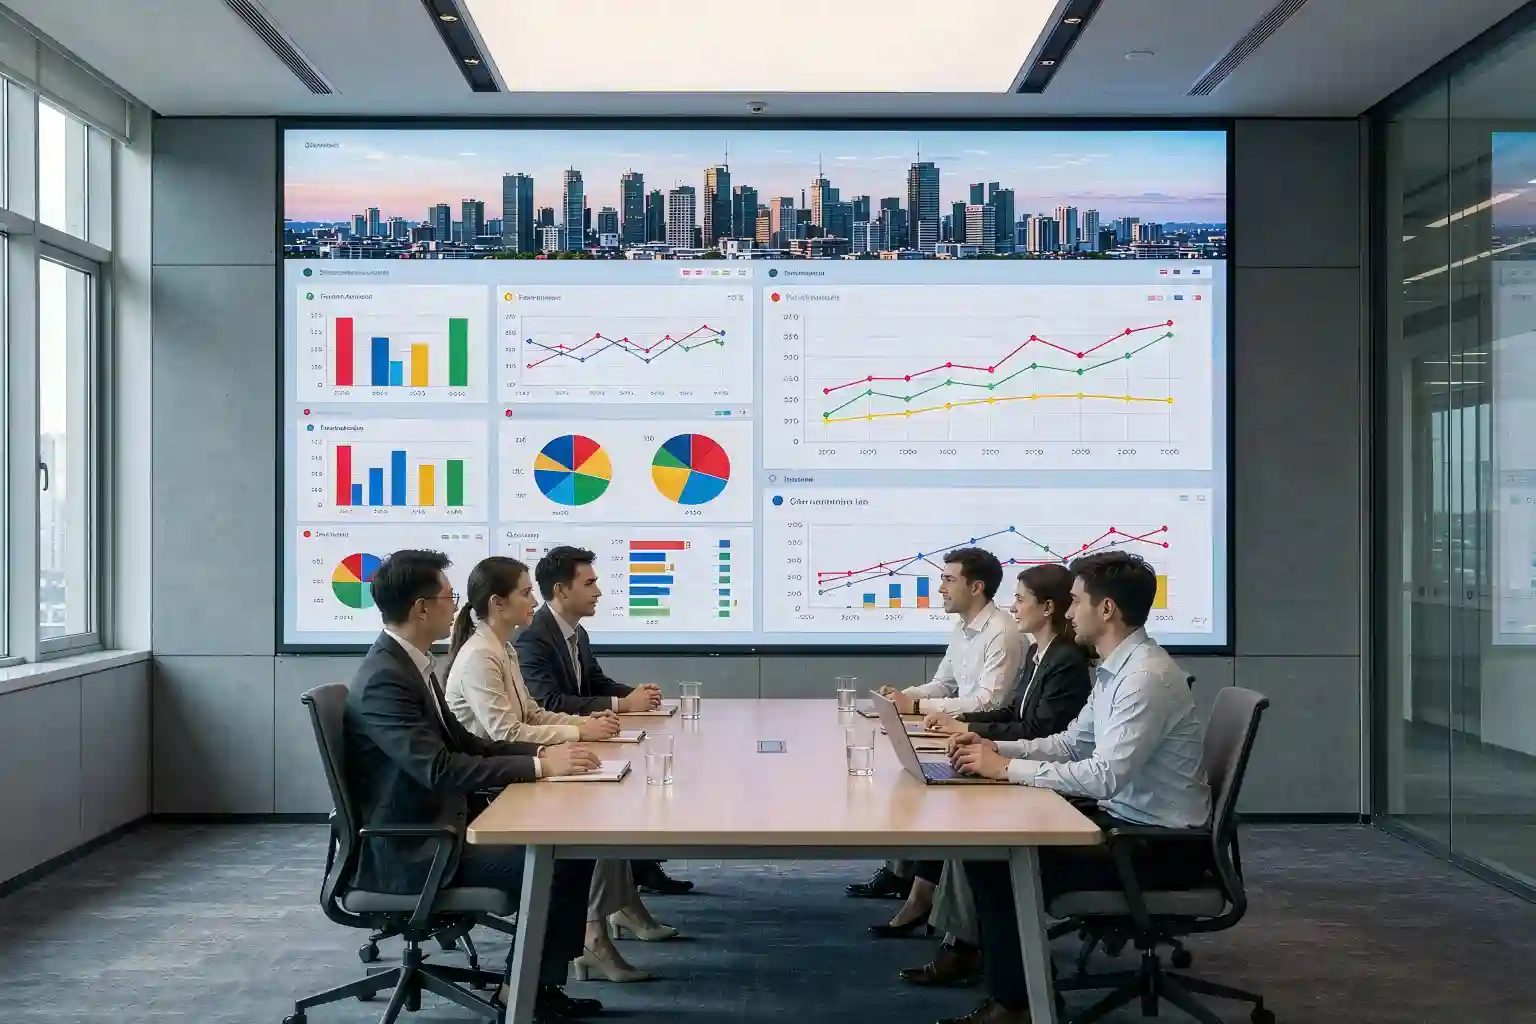
A meeting-room project: a 6.4 m × 1.8 m fine-pitch LED wall. The team eyeballed the total power at "roughly 300W per square meter" and left a single 16A circuit for the job. On acceptance day, they fired the full-screen white-balance test — and fifteen minutes in, the breaker tripped. Reworking the electrical side cost them a week of schedule.
Where did it go wrong? Average power and peak power are two different numbers. While playing normal video content, a screen draws only about 30% of its peak. It "feels" efficient. But full-white test patterns, calibration routines, and worst-case content push the draw right up to the peak. Electrical infrastructure must be sized for the peak — never the average.
Resolution failures are just as common: the video processor outputs 3840×2160 while the wall's actual pixel grid is 5120×1440. The image gets force-stretched and the text goes soft. Clients notice immediately.
2. Screen Resolution Calculation: One Formula Does It All
LED displays have no fixed pixel density — pixel pitch is the single source parameter. Pitch is the center-to-center distance between adjacent pixels, in millimeters: P1.25 means 1.25mm, P2.5 means 2.5mm.
The Core Formulas
Horizontal resolution = width (m) × pixels per meter
Vertical resolution = height (m) × pixels per meter
3. Power Consumption Calculation in Three Steps
There are two ways to calculate total screen power: the theoretical method and the engineering method. The theoretical method explains the physics; for quoting and electrical design, engineers rely on the W/m² figure in the manufacturer's spec sheet. You need both — tenders love to test the theory.
Step 1: Peak Power per Pixel
Red ≈ 2.0V; blue/green ≈ 3.0V; current is set by the driver IC (typically 5–20 mA per color on fine pitch)
At 5 mA per color: P ≈ (2.0 + 3.0 + 3.0)V × 5 mA ≈ 0.04 W per pixel. That's the full-white, full-brightness ceiling. Playing real video, only about a third of pixels are lit at any moment — that gap between ceiling and reality is exactly the difference between maximum power and average power.
Step 2: Total Peak Power of the Wall
Average power ≈ total peak power × 30%
Take the peak density straight from the spec sheet (fine-pitch screens typically run 300–500 W/m²; COB LED displays often come in lower at the same pitch thanks to better thermal performance and luminous efficiency). If your theoretical number diverges wildly from the spec sheet, check the scan mode first — a 1/32 scan dramatically cuts instantaneous peak current.
Step 3: Number of Power Supplies
The 0.8 is the safe loading factor: running switching power supplies at full rated load continuously overheats them and shortens their life. Industry practice reserves 20% headroom, rounds up, and distributes PSUs evenly across cabinets.
4. Cables & Breakers: Sizing the Electrical Side
Once total power is known, three things remain on the electrical side: compute current, pick the cable cross-section, and select the breaker.
Current Calculation
Three-phase 380V: I = P ÷ (√3 × V × cosφ)
Cable Sizing (Copper, Reference Ampacity)
| Copper cross-section | Reference ampacity | Typical use |
|---|---|---|
| 1.5 mm² | ≈ 15A | Short in-cabinet module runs |
| 2.5 mm² | ≈ 21A | Cabinet power input |
| 4 mm² | ≈ 28A | Screen-to-distribution main (small/medium walls) |
| 6 mm² and up | ≈ 36A+ | Large-wall mains, three-phase feeds |
5. Worked Example: 11.52 m² P1.25 COB LED Display
Let's chain the formulas together. Project conditions: a meeting-room LED video wall, P1.25 COB LED display, 6.4 m × 1.8 m (11.52 m²), spec-sheet peak density 400 W/m², 300W-rated switching PSUs, single-phase 220V supply.
Step 1 · Resolution
Resolution = 5120 × 1440 ≈ 7.37M pixels → verify ≥ 12 receiving cards
Step 2 · Total Power
Average power ≈ 4608 × 30% ≈ 1382 W
Step 3 · Power Supply Count
Step 4 · Current & Distribution
Breaker ≥ 1.25 × 23.3 ≈ 29A → use a 32A 2-pole breaker
Main cable: 4 mm² copper (≈28A, close to the limit — 6 mm² is the safer call)
6. Key Takeaways
| Item | Core Formula | Engineering Note |
|---|---|---|
| Screen resolution | (1000 ÷ pitch) × screen dimensions | Cross-check receiving-card count |
| Minimum viewing distance | min. distance (m) ≈ pitch figure | Comfortable distance ≈ 3–5× minimum |
| Power per pixel | P = Σ (V color × I color) | Red ≈ 2.0V; blue/green ≈ 3.0V |
| Total peak power | Peak density (W/m²) × area | Size power for the peak; average is only ~30% |
| PSU count | Peak power ÷ (rated × 0.8) | Round up; distribute across cabinets |
| Current / cable | I = P ÷ (V × cosφ) | Breaker ≥ 1.25 × I; size copper by ampacity table |
7. FAQ
Q1: Why are power supplies only loaded to 80%?
At full rated load, switching PSUs run hot and their electrolytic capacitors age much faster, cutting service life. The 80% loading convention preserves both safety and five-plus years of stable screen operation.
Q2: Does COB LED display power calculation differ from SMD?
The formulas are identical. The difference is in the spec-sheet values: COB packages offer higher luminous efficiency and better heat dissipation, so peak density at the same pitch is usually a bit lower — and COB handles sustained high brightness in control-room and broadcast environments particularly well.
Q3: How does the scan rate (e.g., 1/32 scan) affect power?
Scanning lights only a fraction of the rows at any instant, sharply reducing peak current. A theoretical calculation that ignores scanning will land far above the spec sheet — use the manufacturer's W/m² figure for real-world engineering.
Q4: What if the source resolution doesn't match the screen?
First adjust the sending unit's scaling/cropping so the active signal maps pixel-to-pixel onto the wall. If that's impossible, scale proportionally — never stretch, or text will go visibly soft.
Turn the Math Into a Reliable Delivery
We supply a full range of COB fine-pitch LED displays from P0.9 to P1.5 — every shipment includes a power, distribution, and receiving-card configuration worksheet so your project numbers add up before the truck rolls.
Request a Project Configuration Worksheet / InquiryDisclaimer: Core concepts in this article are adapted from Chapter 3 of the NovaStar NCE certification textbook LED Display Applications — Beginner Level, rewritten in blog form and supplemented with field engineering experience, for industry exchange only. Always defer to the specific product's specification sheet and your local electrical code for actual projects.
COB LED displayLED display power consumptionresolution calculationfine-pitch LEDpower supply sizing